

Before You Start
- Monitoring is available to every role. Users and Managers with restricted site permissions will only see event data for the sites they have permission to. An event created at a site you don’t have permission for won’t show up here for you, even if it came from the same workflow or agent as events you can see.
- Event Intelligence is a template dashboard: a general overview across every site and implementation you have access to. For more targeted, use-case-specific insight, that’s what Published Dashboards (the next item under Monitoring) are for.
Setting the Date Range
Like every Worlds dashboard, custom or template, a date filter sits at the top of the page: today, past 7 days, past 30 days, or a custom range. Every widget on the page reflects whatever range you’ve selected.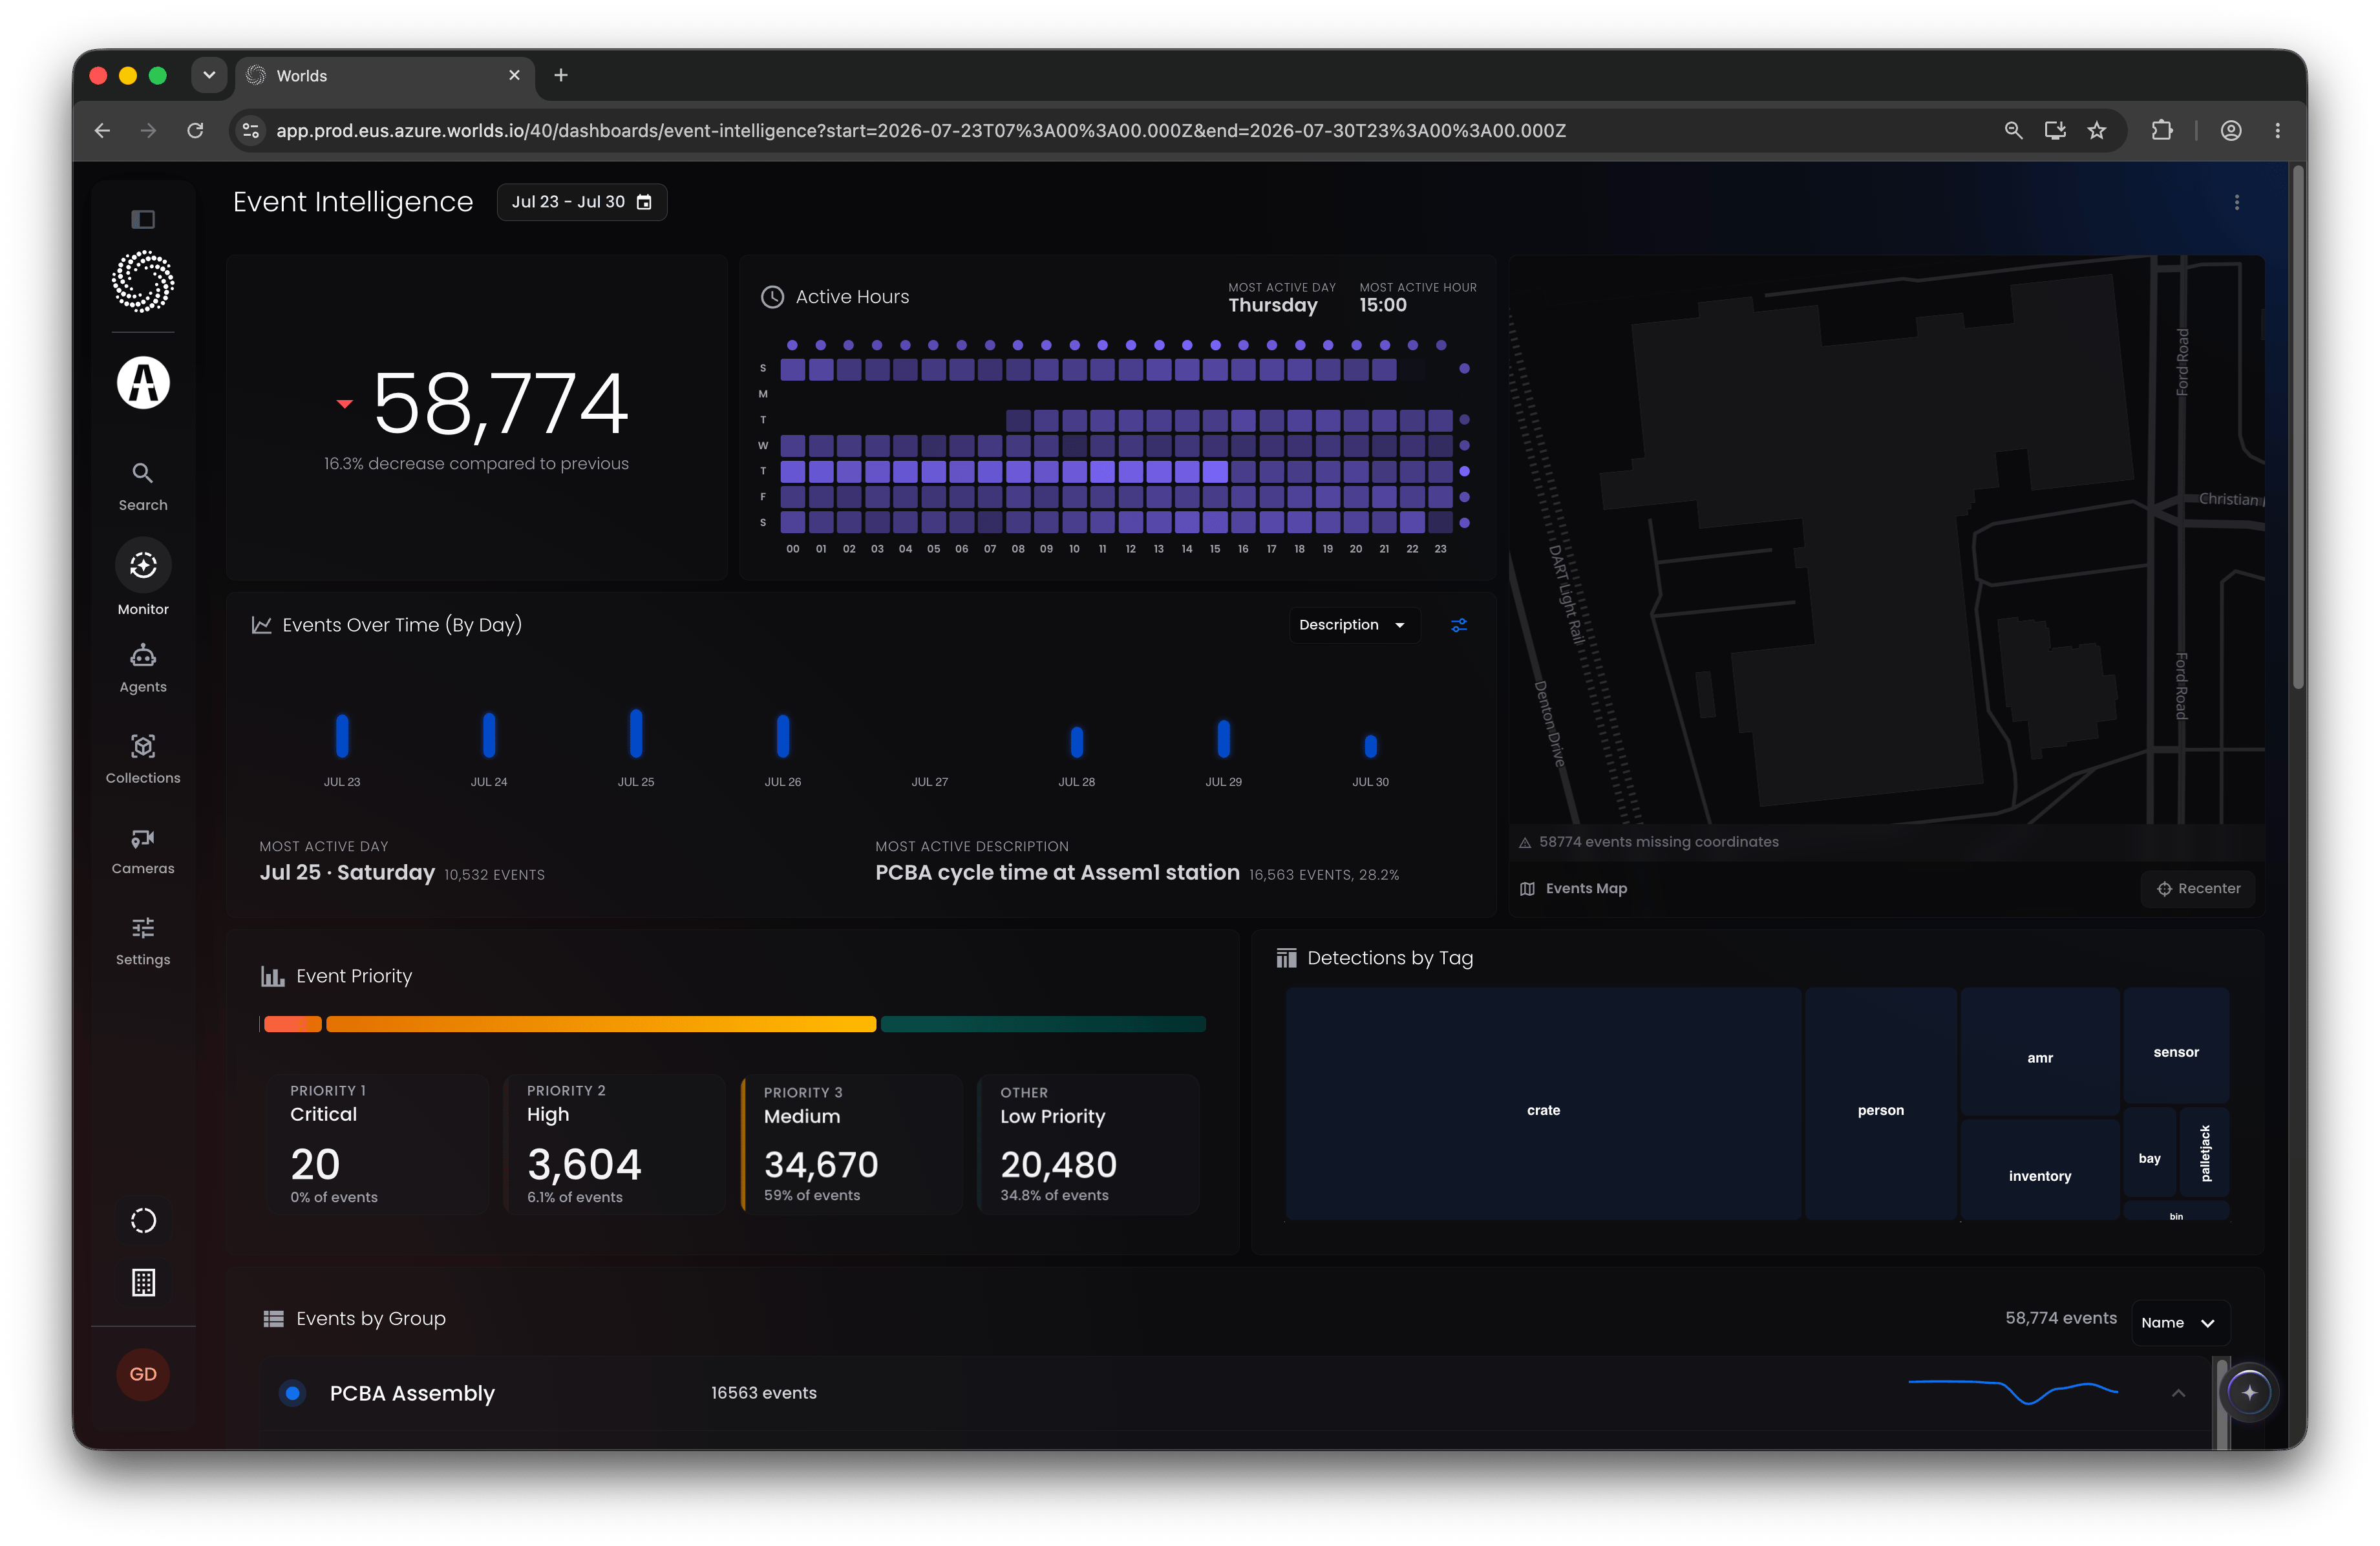
Reading the Widgets
Total Count of Events - top left. A simple total of all events over the selected date range. Active Hours - a heat map of event volume by hour of day and day of week across the selected range. Useful for spotting hotspots, when a given event type tends to happen most or least often. Events Map - top right. Plots events by location. Note: For an event to show up here, two things have to be true: the camera that detected it must be calibrated (so its pixel location can translate to an accurate lat/long), and the workflow that created the event must append that GPS position to the event itself. Calibration alone isn’t enough. Events Over Time - relative event volume by date. Filter to a specific event type in the top right, or categorize by name, description, agent, or priority. Categorizing calls out the most active event type over the range, along with the single most active day. Event Priority - relative breakdown of events by priority. Priority is set by the workflow that creates the event, as an integer in the priority field: 1 (Critical), 2 (High), or 3 (Medium). Anything null or outside that range displays as low priority here. Detections by Tag - a rough sense of which objects your cameras see most often. Note: This widget doesn’t reflect every raw detection your models produce. It only counts objects tagged to an event through a metadata tag field. If you want this widget to actually reflect what your cameras are seeing, your workflows need to write the detected object into that tag field. Events by Group - bottom of the page. Lists every event over the selected range. Use the dropdown in the top right to group by name, description, agent, or priority; each row shows a count plus a sparkline of how that event type trended over the range. Click any row to see its five most recent events, then click a thumbnail to open that event’s full detail page in a new tab. Note: Thumbnails depend on a still image being attached to the event as an asset. If you want events to show a thumbnail here, your workflow needs to generate that still image and attach it to the event.Dashboard-Wide Options
The ellipses menu in the top right applies to Event Intelligence and to any custom or published dashboard:- Copy dashboard URL - share the dashboard with other Worlds users
- Export PDF - one widget per page, useful for sharing with stakeholders
- View Event Activity (Event Intelligence only) - opens the Event Activity list view, carrying over whatever filters are currently applied
- Refresh - pull the latest data
Quick Reference
- Access - every role; Users and Managers see only events from sites they have permission to
- Widgets - Total Count, Active Hours, Events Map, Events Over Time, Event Priority (1 Critical, 2 High, 3 Medium), Detections by Tag, Events by Group
- Events Map - needs both camera calibration and a workflow-appended GPS position
- Detections by Tag - only reflects tagged objects, not raw detections
- Thumbnails - require a still image asset attached by the workflow
- Ellipses menu - copy URL, export PDF, jump to Event Activity, refresh
- Next up - Published Dashboards, for use-case-specific views beyond this general overview