> ## Documentation Index
> Fetch the complete documentation index at: https://docs.worlds.io/llms.txt
> Use this file to discover all available pages before exploring further.
# Published Dashboards
> Browse fully custom dashboards built from Worlds' data visualization widget library.
Beyond the general Event Intelligence overview, Worlds supports fully custom dashboards, built from a large and growing library of data visualization widgets (plus custom-coded widget types), tailored to a specific use case. Any dashboard that gets built appears here, on the Published Dashboards page under Monitoring.
## Before You Start
* Building a dashboard is currently limited to Super Administrators, so in practice it's usually the Worlds forward-deployed engineering team that builds these, tailored to specific business insights and use cases. Worlds is working to open this up to more end users over time.
* This guide covers viewing and navigating published dashboards. For how to actually build one, see the [Dashboard Management](/monitoring/dashboard-management) guide.
* Once published, a dashboard is available to every user in the org, but the same site-permission scoping applies as elsewhere in Monitoring: Users and Managers with limited site permissions can open the same dashboard as everyone else, but any site they don't have permission to simply won't populate data for them.
## Browsing Dashboards
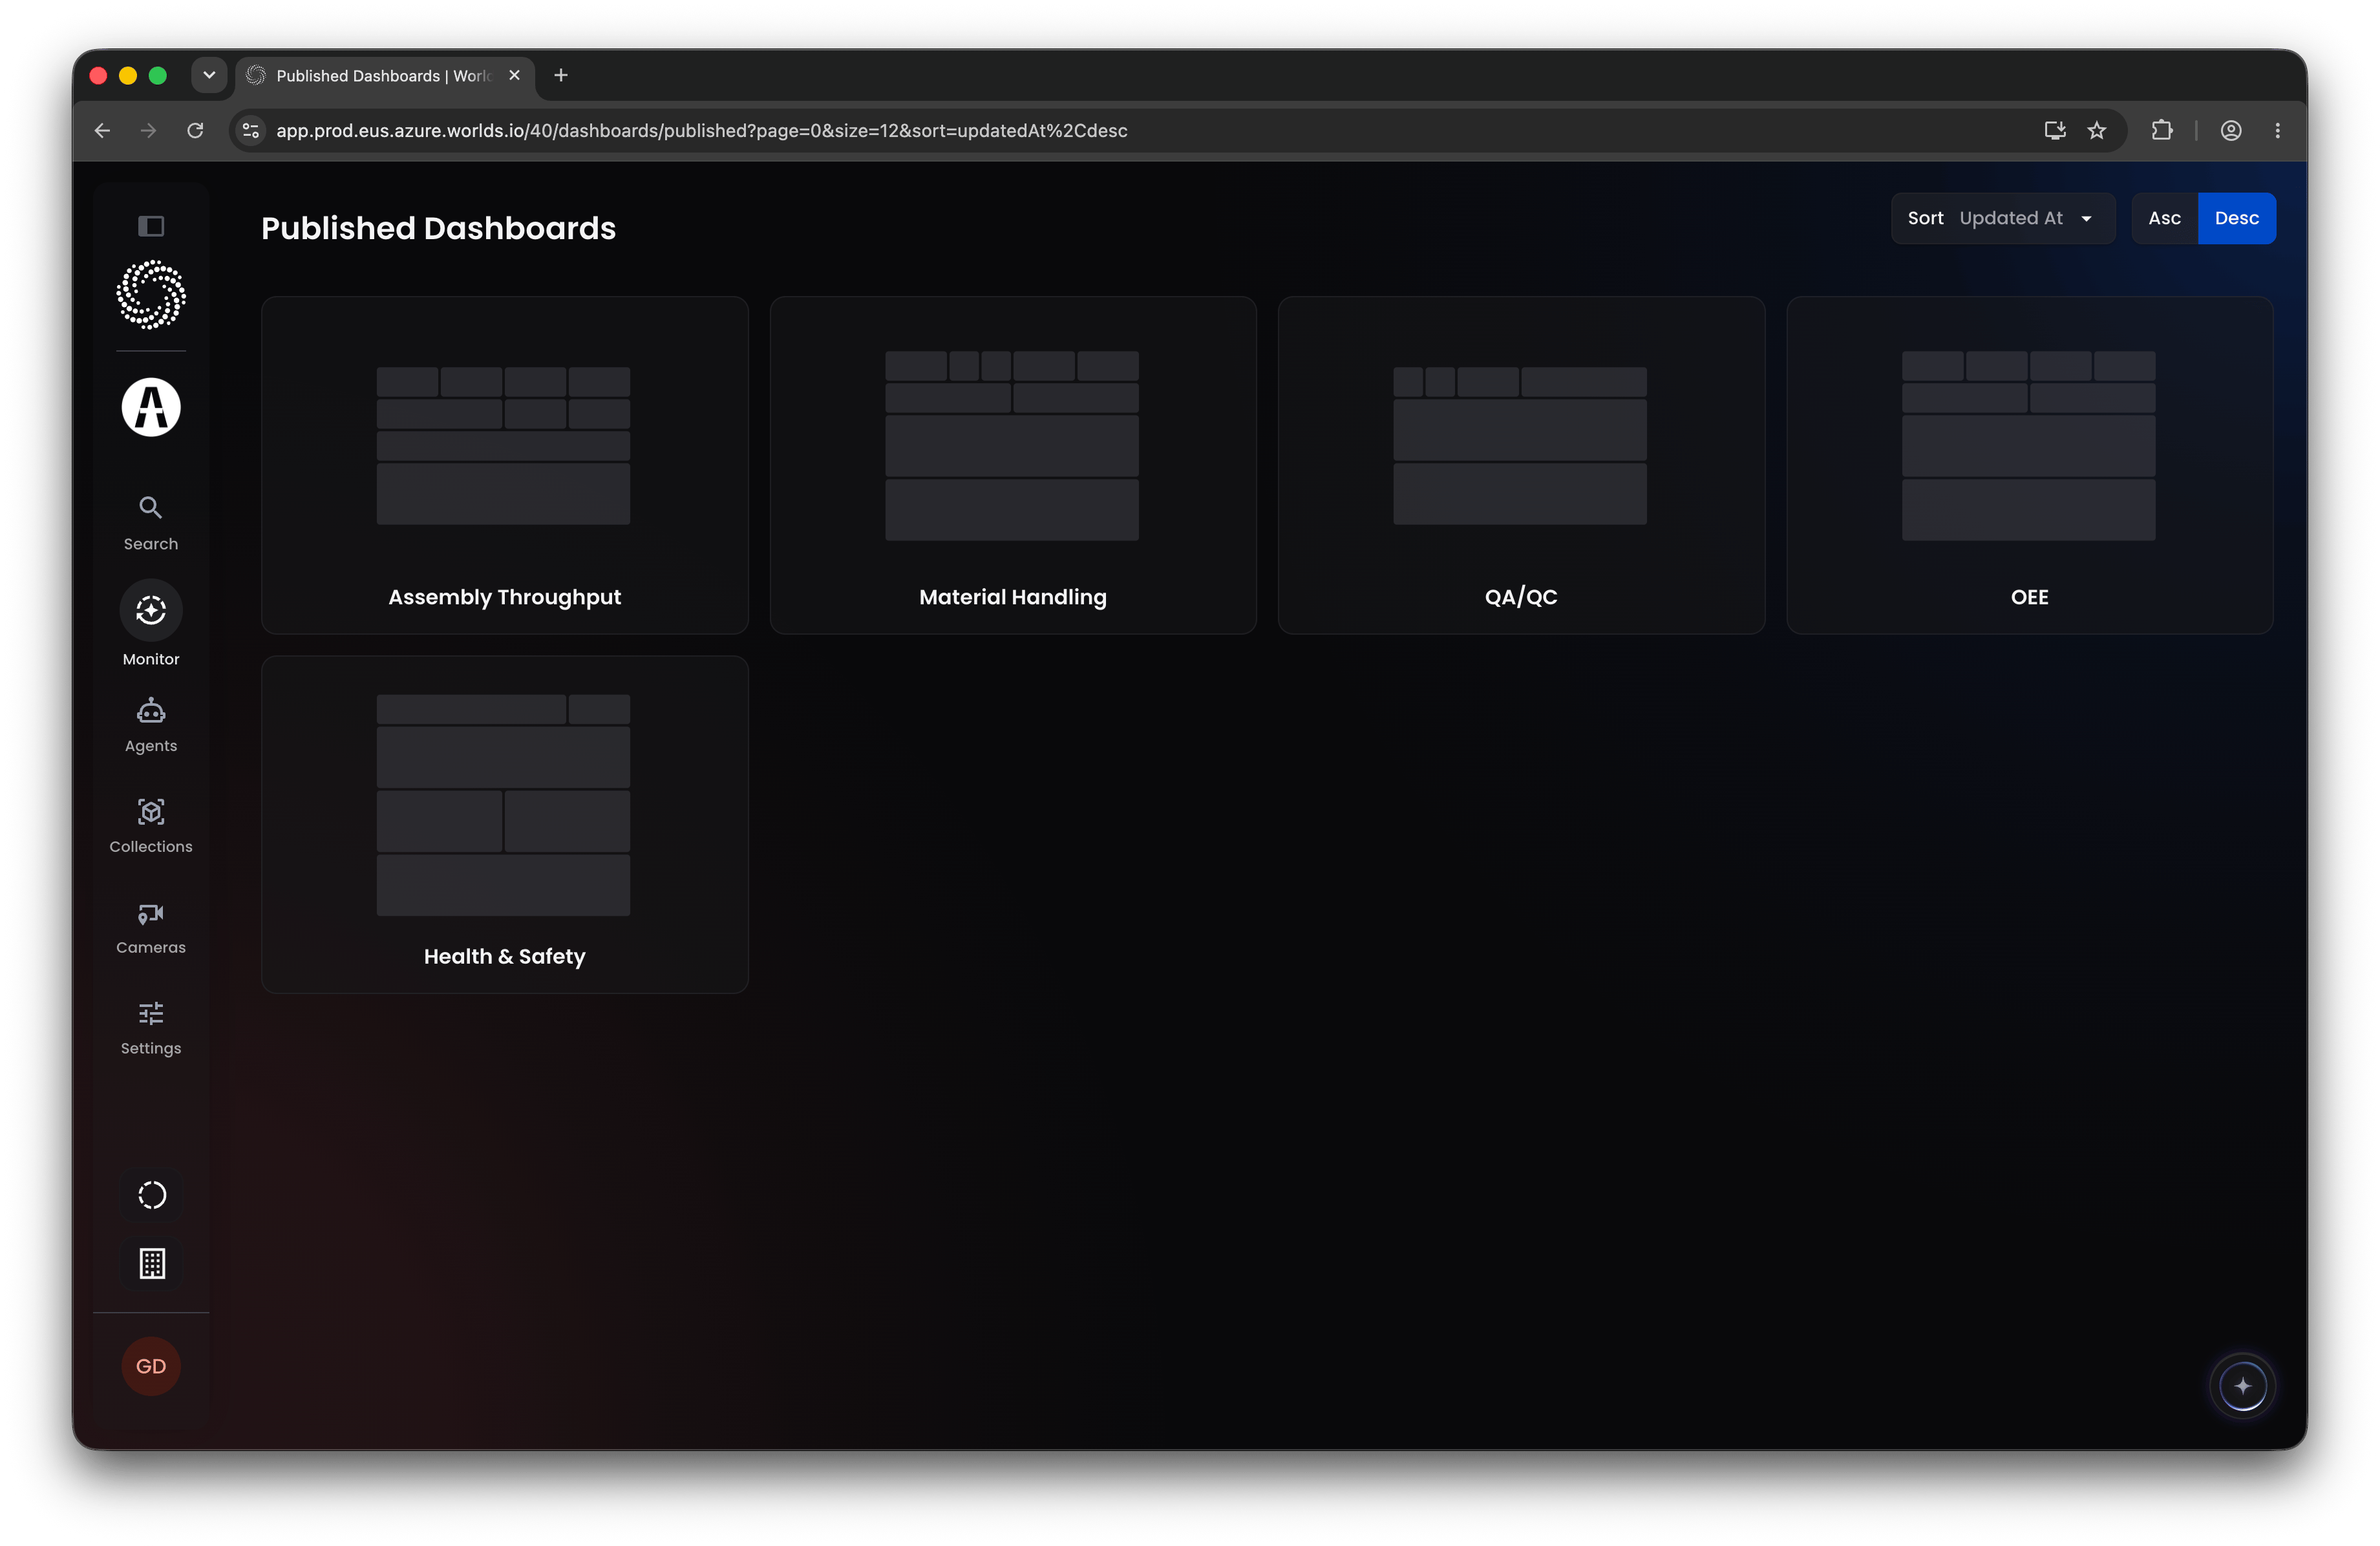
The Published Dashboards page defaults to sorting by most recently updated. Use the controls at the top to sort by name instead, or change the sort order. Each dashboard shows its name alongside a thumbnail preview of its layout and widgets.
 ## Opening a Dashboard
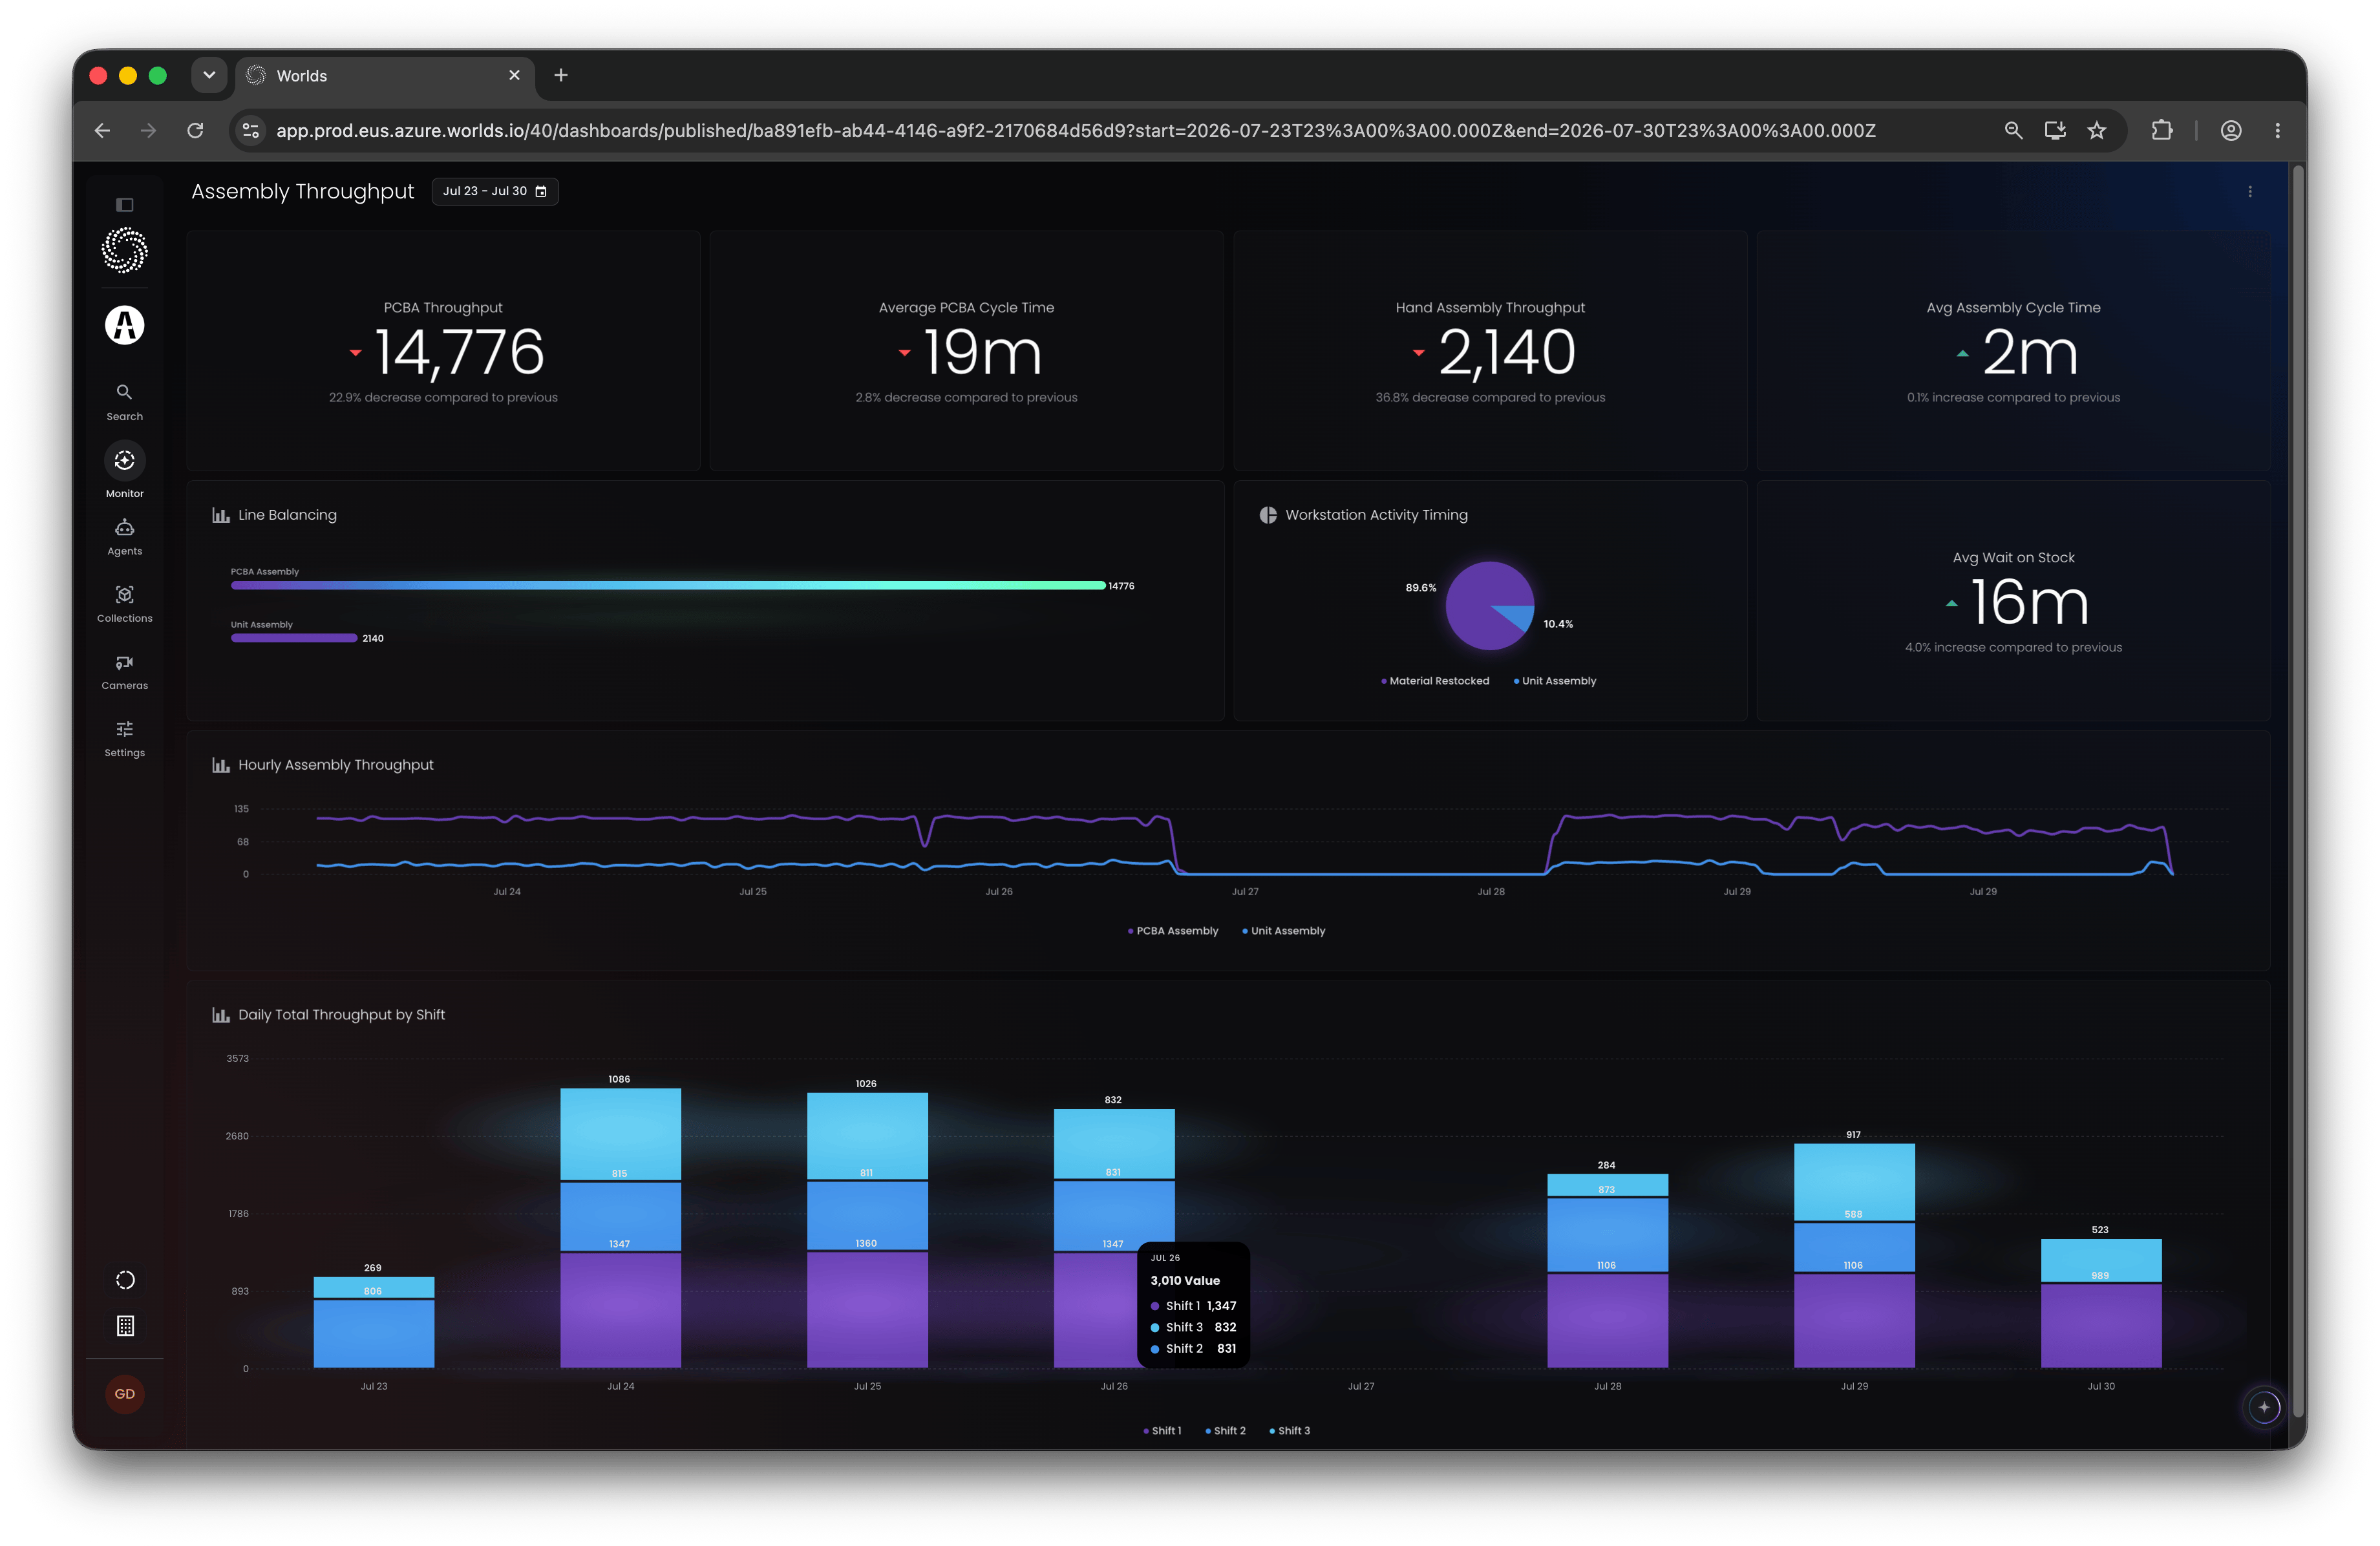
Clicking into any dashboard loads live data into every widget it's configured with, the same way Event Intelligence does. Depending on how it's built, you might see counts, pie charts, bar or column charts, timelines, line charts, or maps, there's effectively no limit to what can be visualized given the widget library and custom-code support available to whoever builds it.
**Tip:** Most widgets support a hover state, hover over a value to see the underlying data behind it: series values and categories in a line chart, totals and percentages in a pie chart, or exact counts in a stacked bar chart.
## Opening a Dashboard
Clicking into any dashboard loads live data into every widget it's configured with, the same way Event Intelligence does. Depending on how it's built, you might see counts, pie charts, bar or column charts, timelines, line charts, or maps, there's effectively no limit to what can be visualized given the widget library and custom-code support available to whoever builds it.
**Tip:** Most widgets support a hover state, hover over a value to see the underlying data behind it: series values and categories in a line chart, totals and percentages in a pie chart, or exact counts in a stacked bar chart.
 ## Shared Dashboard Features
Every published dashboard, whatever its layout, shares the same core controls:
* **Date selector** (top) - today, last 7 days, last 30 days, or a custom range
* **Ellipses menu** (top right) - copy the dashboard URL to share with another Worlds user, export a PDF (each widget on its own page), or refresh the dashboard's data
To get back to the full list, use Published Dashboards in the navigation.
## Common Use
Published Dashboards is where you'll find the visualizations Worlds' forward-deployed engineering team has crafted for your specific use cases, distinct from the general overview on Event Intelligence. And wherever you're reviewing data, here or on [Event Intelligence](/monitoring/event-intelligence), [Iris](/platform-overview/iris) is available in the bottom right to answer questions about what you're looking at and help you dig in further.
**Note:** Dashboard-building functionality is expected to open up over time, not just to more end users, but eventually to Iris as well - so any user can help craft new visualizations, with or without Iris' help.
## Quick Reference
* **Creating dashboards** - currently Super Admin only (typically built by the Worlds team); see the [Dashboard Management](/monitoring/dashboard-management) guide for details
* **Access** - every user once published; Users and Managers see only data for sites they have permission to
* **Browsing** - sortable by name or last updated, with thumbnail previews
* **Widgets** - counts, pie/bar/column charts, timelines, line charts, maps, and custom-coded types; hover any value for underlying data
* **Shared controls** - date range selector, plus copy URL / export PDF / refresh from the ellipses menu
* [**Iris**](/platform-overview/iris) - available from any dashboard to ask questions about the data
## Shared Dashboard Features
Every published dashboard, whatever its layout, shares the same core controls:
* **Date selector** (top) - today, last 7 days, last 30 days, or a custom range
* **Ellipses menu** (top right) - copy the dashboard URL to share with another Worlds user, export a PDF (each widget on its own page), or refresh the dashboard's data
To get back to the full list, use Published Dashboards in the navigation.
## Common Use
Published Dashboards is where you'll find the visualizations Worlds' forward-deployed engineering team has crafted for your specific use cases, distinct from the general overview on Event Intelligence. And wherever you're reviewing data, here or on [Event Intelligence](/monitoring/event-intelligence), [Iris](/platform-overview/iris) is available in the bottom right to answer questions about what you're looking at and help you dig in further.
**Note:** Dashboard-building functionality is expected to open up over time, not just to more end users, but eventually to Iris as well - so any user can help craft new visualizations, with or without Iris' help.
## Quick Reference
* **Creating dashboards** - currently Super Admin only (typically built by the Worlds team); see the [Dashboard Management](/monitoring/dashboard-management) guide for details
* **Access** - every user once published; Users and Managers see only data for sites they have permission to
* **Browsing** - sortable by name or last updated, with thumbnail previews
* **Widgets** - counts, pie/bar/column charts, timelines, line charts, maps, and custom-coded types; hover any value for underlying data
* **Shared controls** - date range selector, plus copy URL / export PDF / refresh from the ellipses menu
* [**Iris**](/platform-overview/iris) - available from any dashboard to ask questions about the data