> ## Documentation Index
> Fetch the complete documentation index at: https://docs.worlds.io/llms.txt
> Use this file to discover all available pages before exploring further.
# Overwatch
> Monitor real-time events and object tracks laid over a map of your site in Overwatch.
Overwatch is Worlds' primary view for spatial, live monitoring data, real-time events and object tracks laid over a map of your site.
## Before You Start
* Available to every role. Managers and Users only see data for sites they have permission to.
* The first time you open Overwatch, the first site in your organization loads automatically. If you have access to multiple sites, the site name in the top left becomes a dropdown to switch between them.
## Getting Oriented
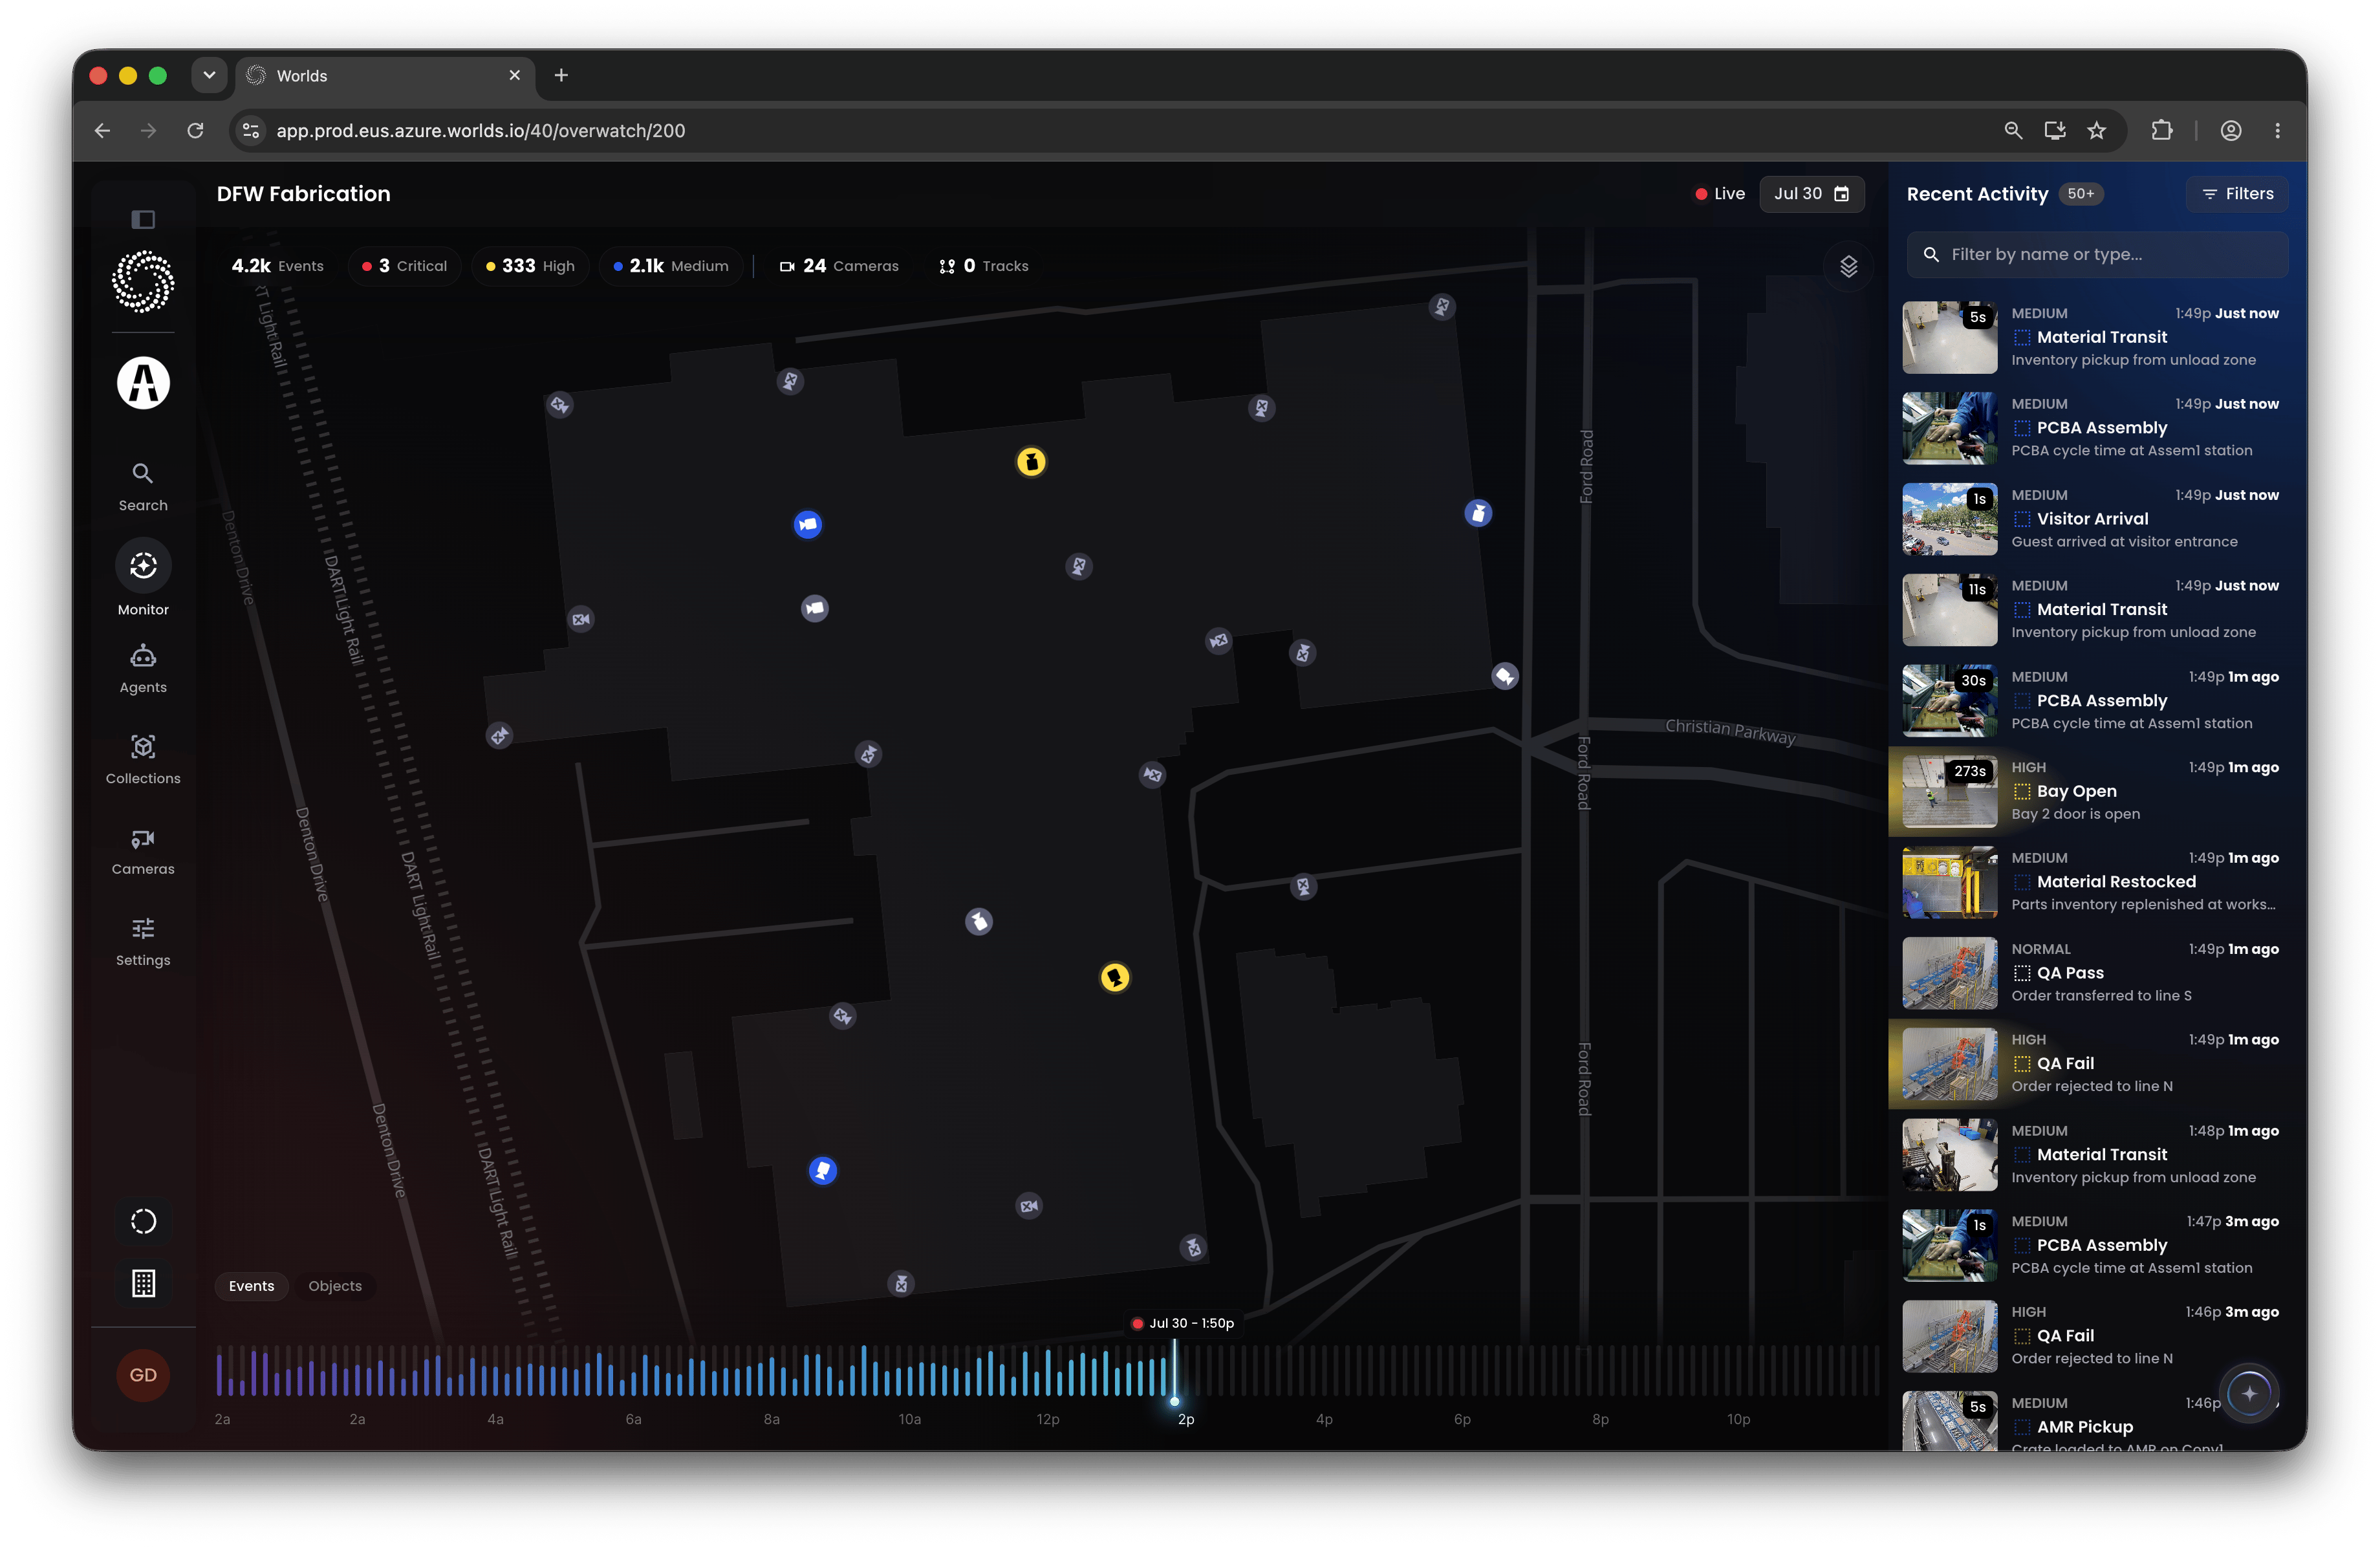
Overwatch shows one day of data at a time. The live indicator next to the date at the top of the screen blinks when new data is actively streaming in, new events appear at the top of the event list on the right and highlight the camera that detected them.
Click the date in the top right to open a date picker and review a full day's worth of past Overwatch data.
**Tip:** When you load a site, the map should center and zoom to it automatically. If the default zoom isn't right, that's controlled by the site bounds configured in [Builder](/sites-and-cameras/builder), adjust the bounds there to change what Overwatch defaults to.
 ## Top Metrics
Across the top of the screen:
* **Total events** for the selected date
* **Events by priority** - 1 (Critical), 2 (High), 3 (Medium)
* **Camera count** associated with the site
* **Track count** - defaults to zero until you enable object tracks (see below)
## Top Metrics
Across the top of the screen:
* **Total events** for the selected date
* **Events by priority** - 1 (Critical), 2 (High), 3 (Medium)
* **Camera count** associated with the site
* **Track count** - defaults to zero until you enable object tracks (see below)
 ## The Histogram and Objects Tab
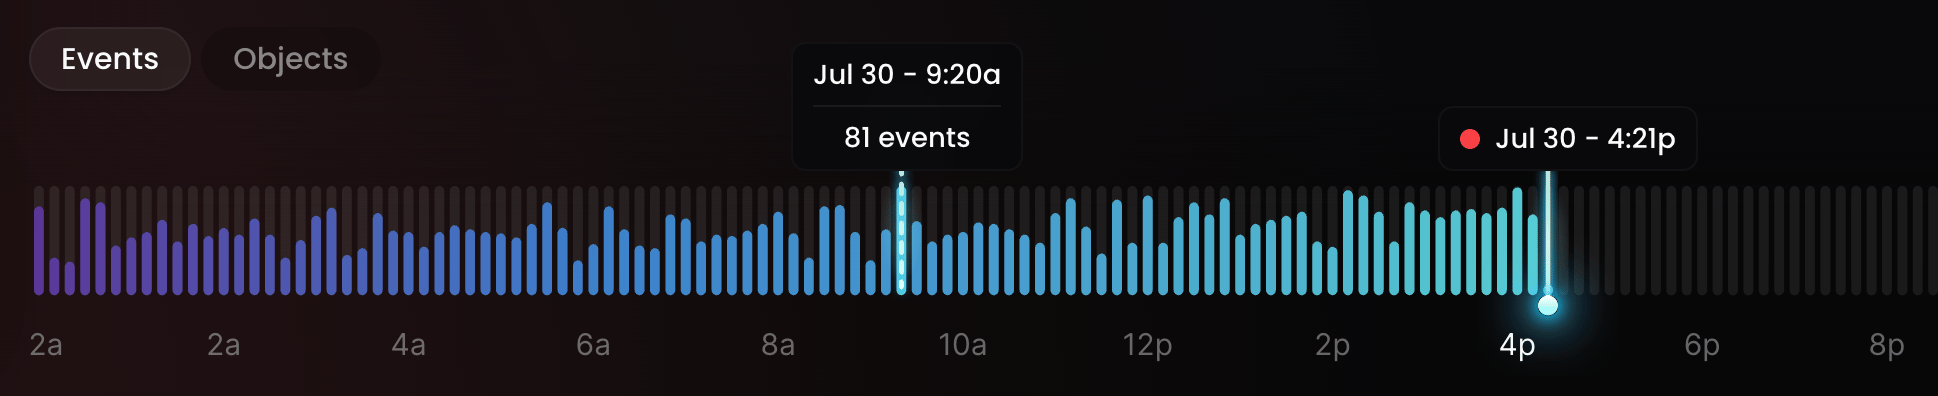
The histogram along the bottom is interactive, click back in time to see events from that period. It's a quick way to see when activity is heaviest, on top of the right panel, which always keeps the most recent event at the top.
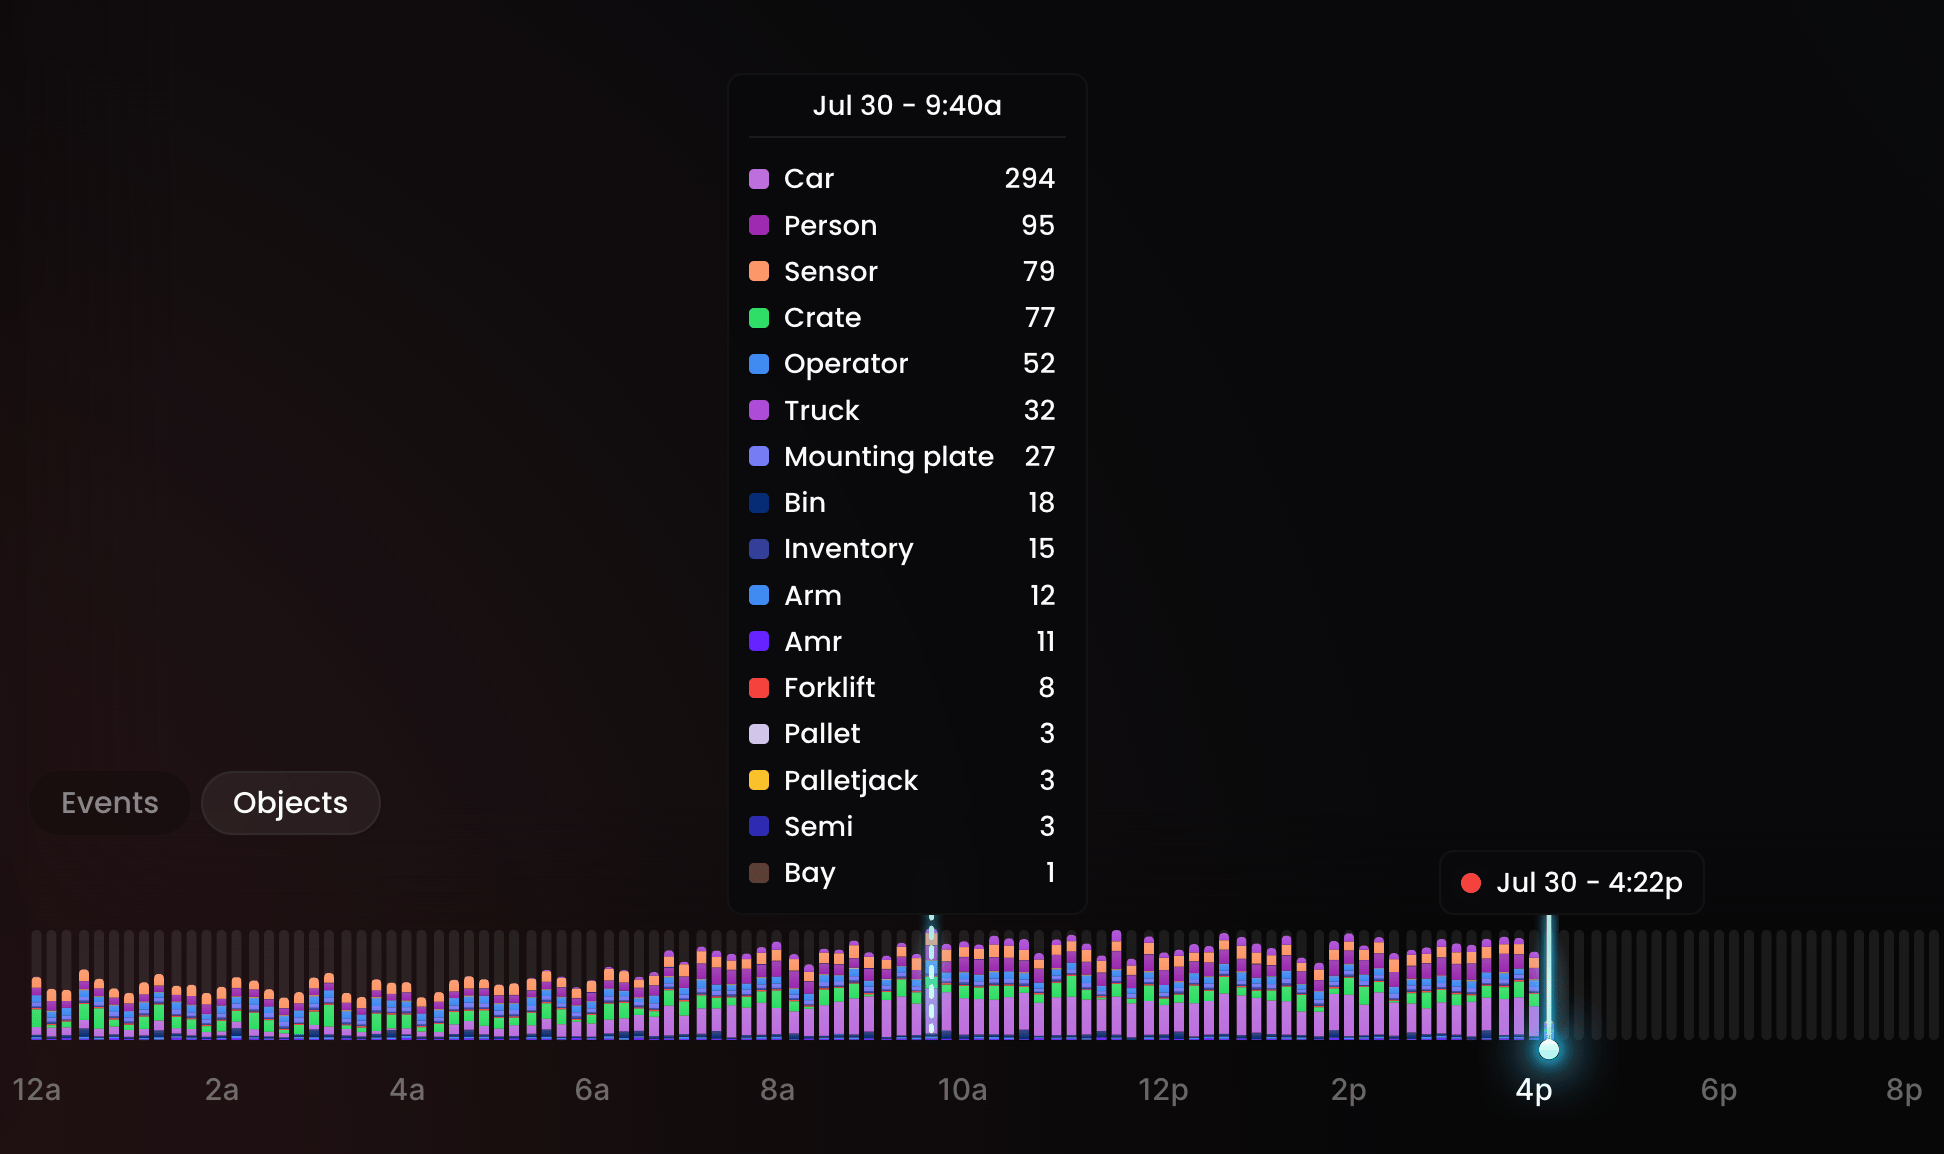
Tab the histogram over to **Objects** to see a similar breakdown, but for every detected object, the raw output of every live computer vision detector running on cameras at this site, not just posted events. A small filter menu appears in the bottom right in this view to hide or show individual object types.
## The Histogram and Objects Tab
The histogram along the bottom is interactive, click back in time to see events from that period. It's a quick way to see when activity is heaviest, on top of the right panel, which always keeps the most recent event at the top.
Tab the histogram over to **Objects** to see a similar breakdown, but for every detected object, the raw output of every live computer vision detector running on cameras at this site, not just posted events. A small filter menu appears in the bottom right in this view to hide or show individual object types.
 ## Map Layers and Object Tracks
The layers icon in the top right of the map lets you toggle: showing or hiding cameras, hiding inactive or disabled cameras, and showing each camera's field of view.
From the same menu, under Tracks, you can enable individual object classes (populated from every unique class your models detect at this site), forklift or person, for example, to see where that object has been seen on the map over the course of the day.
**Tip:** Loading a track pulls a large volume of data, give it a second to render after enabling one.
**Note:** Tracks are especially useful at larger sites, sometimes alongside GPS tracking devices and geofences for event logic. More commonly, though, event logic is tied to a specific camera, in which case that camera's tracks can only appear on the Overwatch map if the camera is calibrated. Calibration happens in [Builder](/sites-and-cameras/builder).
## The Activity Panel
The right panel streams events and activity. While the live indicator is on, new events publish here as they're detected, and highlight the relevant camera as they appear.
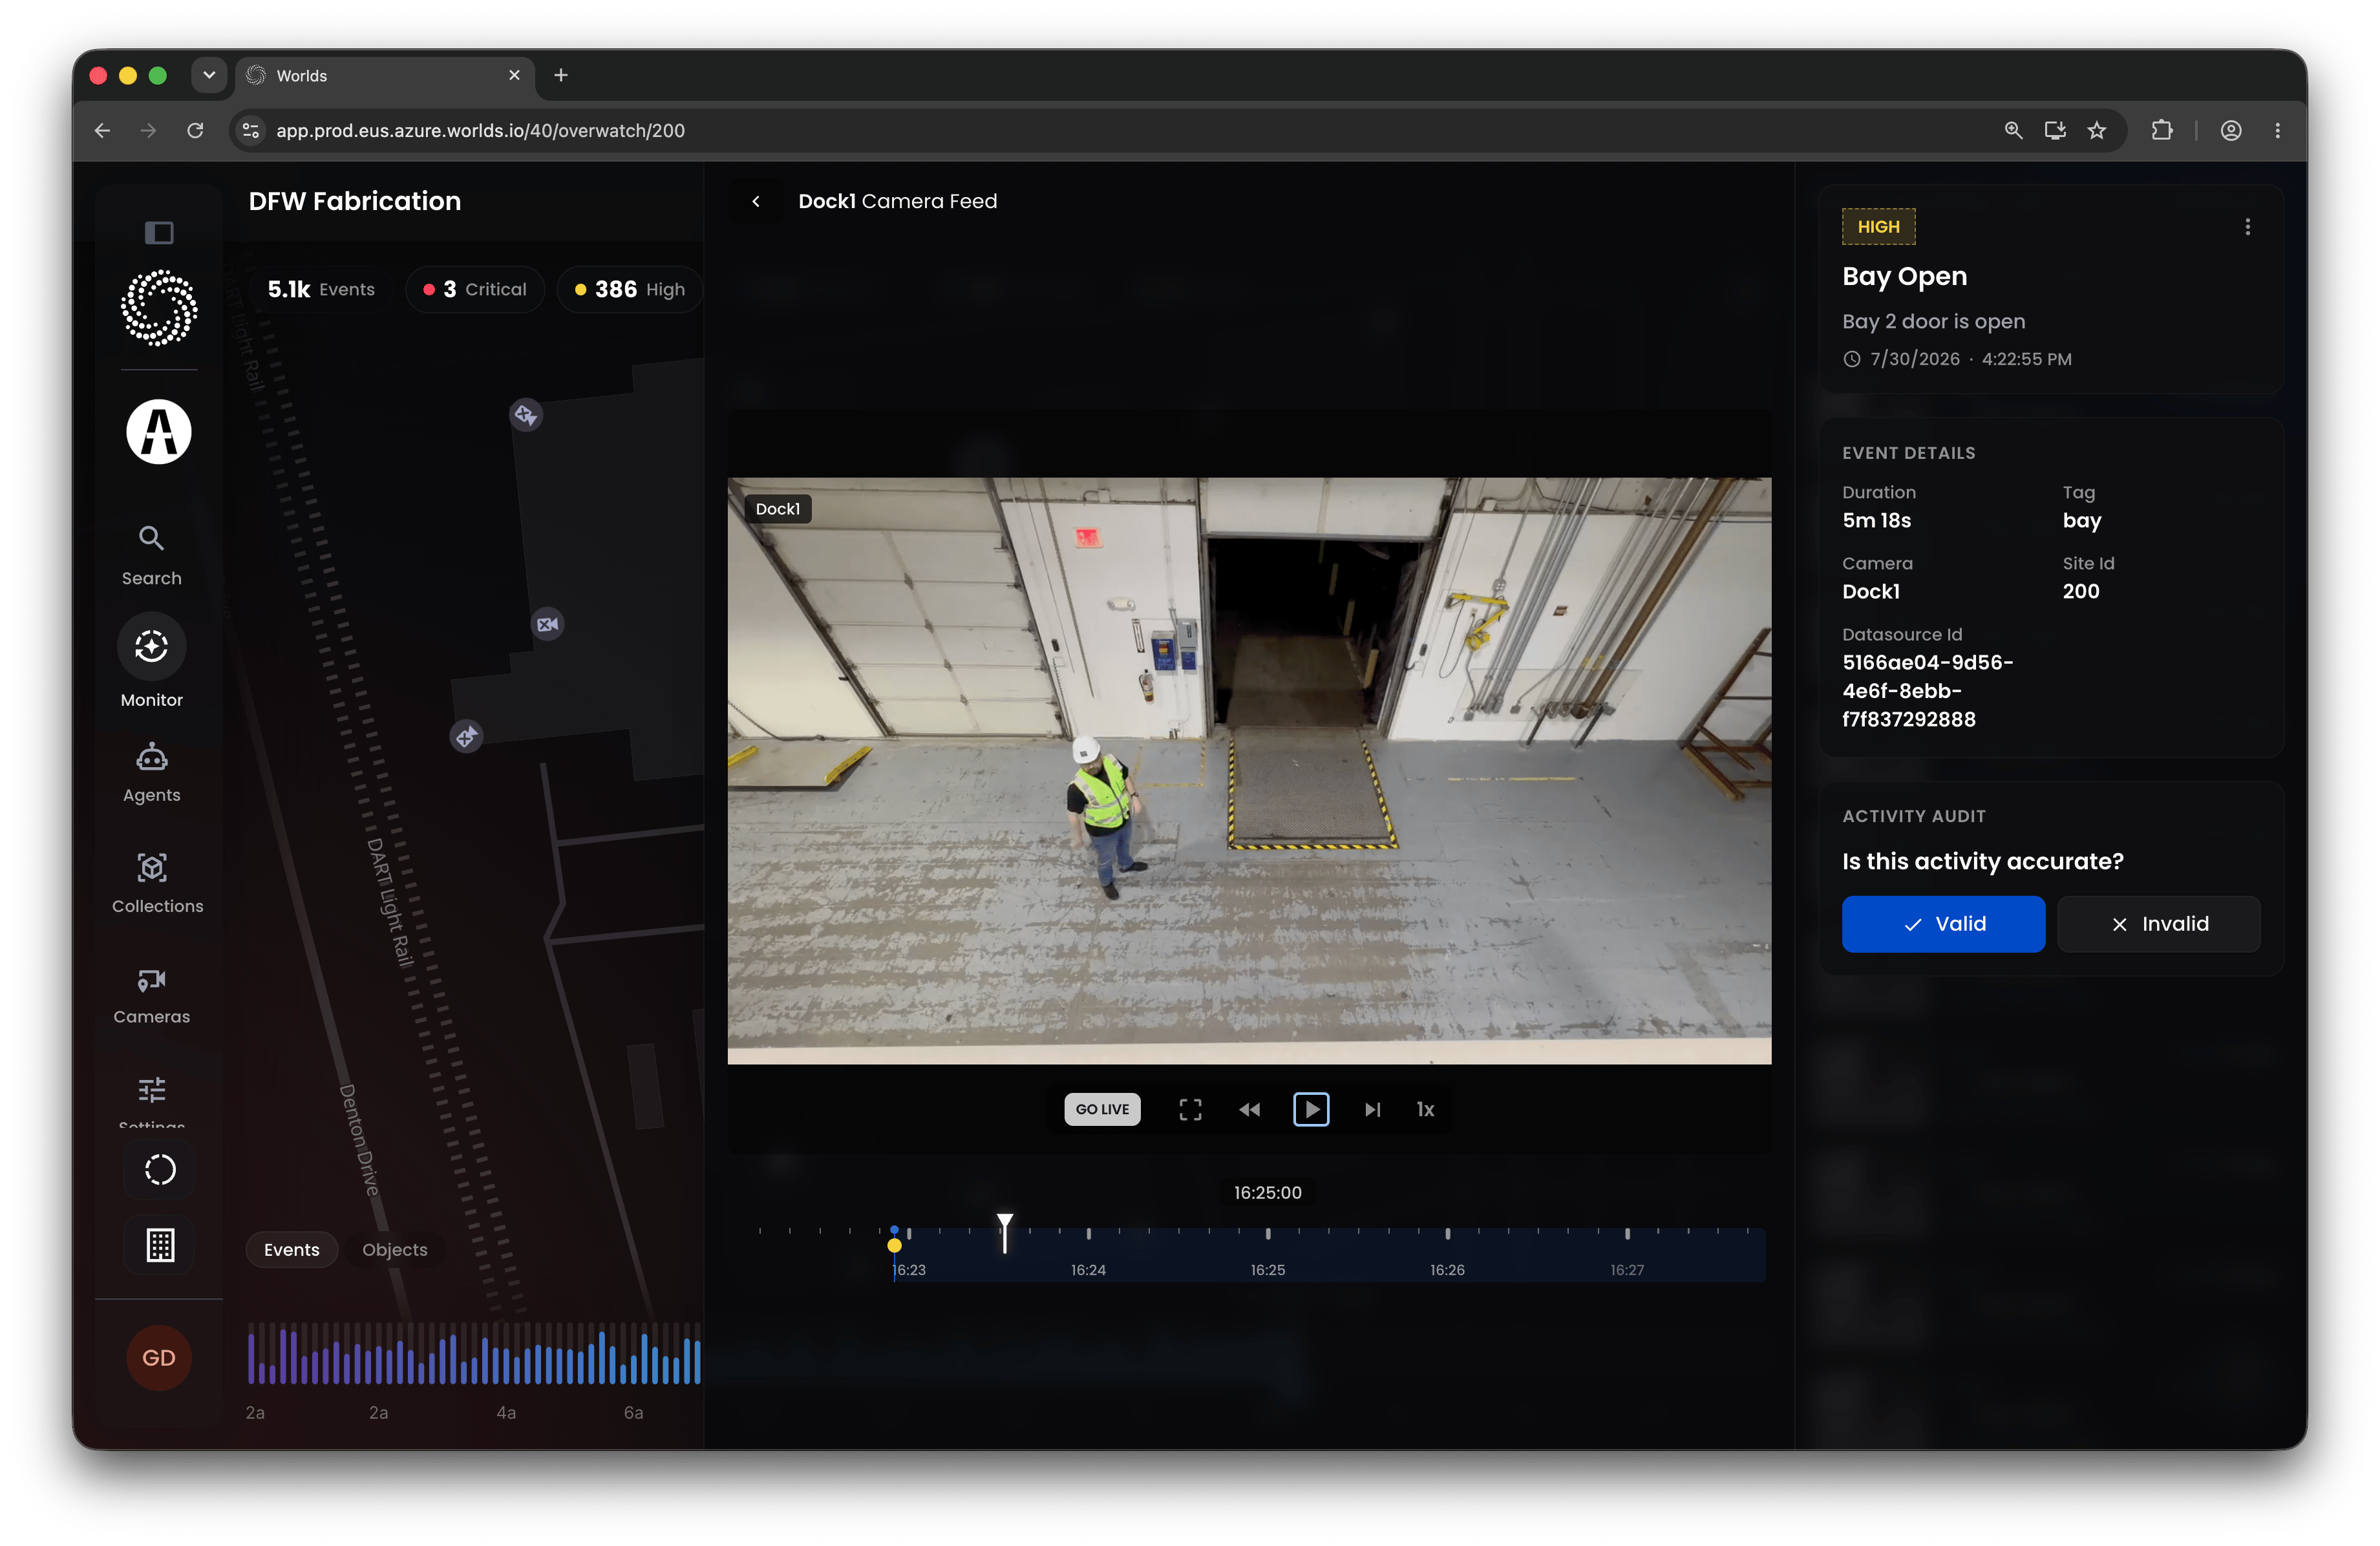
Click any event to open its video and captured details, where you can also mark it **Valid** or **Invalid**.
* Validating takes one click.
* Invalidating lets you choose an existing reason or type a new one, plus add notes.
**Tip:** Valid/Invalid marks are useful two ways: teams splitting live-monitoring responsibility across a large site can see at a glance whether a teammate already reviewed an event, and the same data helps engineers tune detection logic and improve accuracy over time.
The small menu at the top of an event's detail panel links to its full record in [Event Activity](/monitoring/event-activity). Close the panel by clicking outside it or clicking the arrow in the top left.
Use the search field at the top of the activity list to find an event by name, or click the filters icon for more powerful filtering: by agent, label, priority, name, camera, and more.
## Map Layers and Object Tracks
The layers icon in the top right of the map lets you toggle: showing or hiding cameras, hiding inactive or disabled cameras, and showing each camera's field of view.
From the same menu, under Tracks, you can enable individual object classes (populated from every unique class your models detect at this site), forklift or person, for example, to see where that object has been seen on the map over the course of the day.
**Tip:** Loading a track pulls a large volume of data, give it a second to render after enabling one.
**Note:** Tracks are especially useful at larger sites, sometimes alongside GPS tracking devices and geofences for event logic. More commonly, though, event logic is tied to a specific camera, in which case that camera's tracks can only appear on the Overwatch map if the camera is calibrated. Calibration happens in [Builder](/sites-and-cameras/builder).
## The Activity Panel
The right panel streams events and activity. While the live indicator is on, new events publish here as they're detected, and highlight the relevant camera as they appear.
Click any event to open its video and captured details, where you can also mark it **Valid** or **Invalid**.
* Validating takes one click.
* Invalidating lets you choose an existing reason or type a new one, plus add notes.
**Tip:** Valid/Invalid marks are useful two ways: teams splitting live-monitoring responsibility across a large site can see at a glance whether a teammate already reviewed an event, and the same data helps engineers tune detection logic and improve accuracy over time.
The small menu at the top of an event's detail panel links to its full record in [Event Activity](/monitoring/event-activity). Close the panel by clicking outside it or clicking the arrow in the top left.
Use the search field at the top of the activity list to find an event by name, or click the filters icon for more powerful filtering: by agent, label, priority, name, camera, and more.
 ## Common Uses
Overwatch works well for a quick check of recent activity, a review of a full day's events at a site, or digging into historical tracks. But its primary purpose is live monitoring: security and safety stakeholders, or really anyone whose job requires reacting to something in real time.
Filter down to the use case that matters (security, safety, whatever it is) and leave the live view running, on a desk monitor or a wall-mounted screen. That gives a team a single pane of glass to get alerted, investigate, and react quickly, a meaningful step up from the older model of a video wall that depends on someone happening to be watching the right camera at the right moment.
## Quick Reference
* **Access** - every role; Managers and Users limited to sites they have permission to
* **Live indicator** - blinking means new data is actively streaming; new events surface at the top of the list and highlight the source camera
* **Date picker** - review a full day of past data
* **Top metrics** - total events, events by priority, camera count, track count
* **Histogram / Objects tab** - events over time, or all raw detections
* **Map layers** - cameras, camera field of view, object tracks
* **Object tracks** - need a calibrated camera (from [Builder](/sites-and-cameras/builder)) to appear on the map
* **Activity panel** - live event stream; mark Valid/Invalid; search and filter by agent, label, priority, name, or camera
* **Primary use case** - live monitoring for security, safety, and any real-time response workflow
## Common Uses
Overwatch works well for a quick check of recent activity, a review of a full day's events at a site, or digging into historical tracks. But its primary purpose is live monitoring: security and safety stakeholders, or really anyone whose job requires reacting to something in real time.
Filter down to the use case that matters (security, safety, whatever it is) and leave the live view running, on a desk monitor or a wall-mounted screen. That gives a team a single pane of glass to get alerted, investigate, and react quickly, a meaningful step up from the older model of a video wall that depends on someone happening to be watching the right camera at the right moment.
## Quick Reference
* **Access** - every role; Managers and Users limited to sites they have permission to
* **Live indicator** - blinking means new data is actively streaming; new events surface at the top of the list and highlight the source camera
* **Date picker** - review a full day of past data
* **Top metrics** - total events, events by priority, camera count, track count
* **Histogram / Objects tab** - events over time, or all raw detections
* **Map layers** - cameras, camera field of view, object tracks
* **Object tracks** - need a calibrated camera (from [Builder](/sites-and-cameras/builder)) to appear on the map
* **Activity panel** - live event stream; mark Valid/Invalid; search and filter by agent, label, priority, name, or camera
* **Primary use case** - live monitoring for security, safety, and any real-time response workflow